Research/Fixed Income / Macro
Floating-Rate Bonds
Aleksandar Dzhumakov
Milan
17 Oct 2026
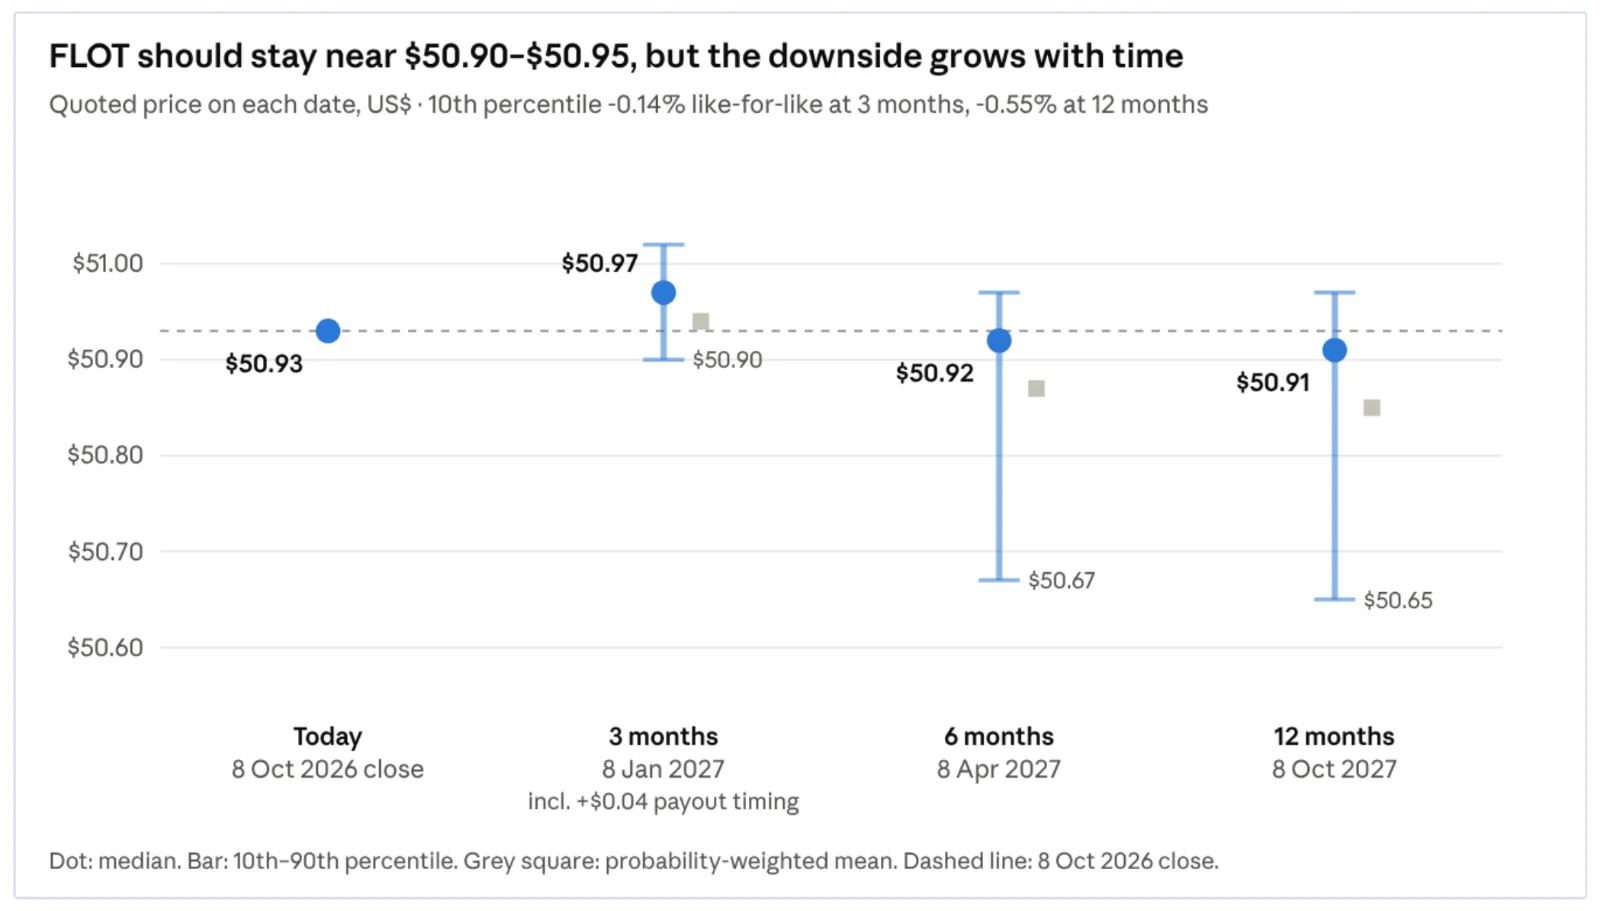
My forecast: investment-grade floating-rate bond prices stay essentially flat over the next 12 months, with the iShares FLOT ETF at about $50.97 on 8 January 2027, $50.92 on 8 April and $50.91 on 8 October 2027 (8 October 2026 close: $50.93). The January figure includes about $0.04 of payout timing; like for like, the price is flat. Investors should expect roughly 4.2% a year, almost all from coupons.
Median forecast for the iShares Floating Rate Bond ETF (FLOT)
| TODAY | 3 MONTHS | 6 MONTHS | 12 MONTHS |
|---|---|---|---|
| $50.93 | $50.97 | $50.92 | $50.91 |
| 8 Oct 2026 close | 8 Jan 2027 · incl. $0.04 payout timing | 8 Apr 2027 · 80% range $50.67–$50.97 | Oct 2027 · 80% range $50.65–$50.97 |
Key Takeaways
-
Context: The Fed and ECB both hiked in September 2026, after an energy shock from the Middle East war, and markets still expect one more Fed hike this year.
-
What drives prices: Coupons reset, so rate hikes barely move prices. Credit spreads do: a 0.25-point wider spread costs FLOT about 0.45%, roughly 90 times more than an equal rate hike.
-
History: Across eight stress episodes since 2011, FLOT's month-end price fell more than 2% only twice (2011, 2020). In hiking cycles the worst fall was 1.5% (2022), and at least 75% of every loss was recovered within 7 months.
-
Risk balance: Spreads are tight (82 bp on the broad investment-grade index, 38 bp on FLOT) and 47.5% of the market is banks, so the upside is a few cents. Downside risk grows with time: the 10th-percentile outcome is about -0.1% at 3 months but about -0.5% at 6 and 12 months. Bank-funding stress is the scenario to watch.
1. Introduction and scope
This report asks one question: where will the prices of investment-grade floating-rate notes (FRNs) be in 3, 6 and 12 months, and why?
The key piece of context is that rates are not just high, they are rising again. The September 2026 decisions by both the Fed and the ECB were rate hikes, not holds, driven by an energy shock linked to the Middle East conflict. That changes which historical periods are fair comparisons.
Scope:
- Main subject: US-dollar, investment-grade corporate FRNs with under 5 years to maturity, measured by the Bloomberg US Floating Rate Note <5 Years Index and its most widely held tracker, the iShares Floating Rate Bond ETF (FLOT).
- Contrast cases: US Treasury FRNs (almost no credit risk) and euro-area FRNs (different benchmark and central bank).
- Not covered: leveraged loans and high-yield floaters. They float too, but their credit risk is far higher, so their price behaviour is a different topic.
Throughout, I label statements as Fact (checked against a primary or official source), Assessment (a source's own judgement) or My view (my reasoning or forecast). Forecasts are mine, not the sources'. Nothing here is investment advice; I am a student, not a licensed adviser.
2. What a floating-rate bond is
An FRN is a loan to an issuer whose coupon is reset regularly to a benchmark rate plus a fixed margin. "Floating" describes how the interest is calculated, not how safe the borrower is. A bank FRN and a Treasury FRN both float, but only one carries meaningful default risk (FINRA).
Fact - a real example. The CIBC pricing supplement (23 June 2026) describes $350 million of two-year notes maturing 26 June 2028. They pay compounded SOFR + 0.66% quarterly, with a 0.66% minimum rate. Three further details in the filing matter for pricing:
- Coupon is set in arrears. SOFR is compounded over the quarter with a five-banking-day lookback, so the holder only learns the coupon at the end of each period.
- Senior unsecured and bail-inable. In a Canadian bank resolution the notes can be converted into shares. This is a real (if remote) credit risk that sits on top of the floating coupon.
- No listing. The issuer warns a secondary market may not develop, so selling before maturity could mean a poor price.
Worked illustration (my numbers). If compounded SOFR averaged 3.88% over a quarter (the overnight level on 7 October), the annualised coupon would be 3.88% + 0.66% = 4.54%. On $10,000 of notes that is roughly $113.50 for the quarter, before day-count adjustments.
Treasury FRNs are different. They index to the 13-week Treasury bill auction rate rather than SOFR, reset weekly, pay quarterly and have a two-year original maturity. Their margin is set at auction. Credit risk is effectively that of the US government, so their prices barely move. I could not open TreasuryDirect with my tools, so these terms rely on long-standing, well-documented Treasury practice.
Euro FRNs usually reference €STR or Euribor. Their coupons follow the ECB, not the Fed, which matters because the two central banks are now moving at different levels (section 4).
3. Why FRN prices move at all
An FRN's price is driven almost entirely by credit spreads, not by central-bank rates. Because the coupon resets every few weeks or months, the bond has almost no interest-rate duration: FLOT's effective duration was 0.02 years on 7 October 2026 (iShares). What does not reset is the quoted margin. If investors start demanding a bigger margin from the same issuer, the old bond is worth less.
The gap between the margin investors now demand (the discount margin) and the margin the bond pays is what moves the price.
What this means for FLOT (My view). FLOT's price moves about 1.8% for each 1-point change in its credit spread, but only about 0.02% for a 1-point change in interest rates:
| Shock | Approx. price change |
|---|---|
| Fed hikes 0.25% | -0.005% (≈ 0.3 cents on a $50.93 share) |
| Spreads widen 0.25% | -0.45% (≈ 23 cents) |
| Spreads widen 1.00% (crisis-type) | -1.8% (≈ 92 cents) |
| Spreads tighten 0.10% | +0.18% (≈ 9 cents) |
The lesson is that a credit-spread move is about 90 times more powerful than an equal-sized rate move. That is why the forecast in section 6 is really a forecast of credit spreads. One caveat: before 2023 many FRNs reset quarterly on LIBOR, so a fast hiking cycle like 2022 also cost some price through reset lag. Today's SOFR notes reset more often and in arrears, so that effect is now small.
Two more forces keep prices near par:
- Pull to par. Each bond is repaid at 100 at maturity. With an average life under two years, any discount shrinks quickly.
- Income, not price, is the return. At a 4.08% 30-day SEC yield, an FRN fund earns about 0.34% a month in coupon. A price fall of that size is erased in a month (all figures from iShares).
4. Market conditions in October 2026
Rates are rising but credit spreads are near historic tights, so FRN coupons are high and prices sit almost exactly at par. That combination is good for income and leaves little room for price gains.
The macro shock (Fact). War in the Middle East broke out on 28 February 2026. Shipping through the Strait of Hormuz has been largely halted and energy prices jumped (ECB FSR, May 2026). Both central banks responded by tightening.
| Measure | Latest Value | Date | Source |
|---|---|---|---|
| Fed funds target range | 3.75-4.00% (hiked from 3.50-3.75%) | 16 Sep 2026 | Fed |
| Fed median dot, end-2026 / end-2027 | 4.1% / 4.1% (one more hike, then hold) | 16 Sep 2026 | Fed SEP |
| Fed median PCE inflation, 2026 / 2027 | 3.7% / 2.3% | 16 Sep 2026 | Fed SEP |
| Overnight SOFR | 3.88% | 7 Oct 2026 | FRED |
| ECB deposit rate | 2.50% (hikes in June and Sept) | 16 Sep 2026 | Banque de France |
| US investment-grade corporate spread (ICE BofA OAS) | 0.82% | 7 Oct 2026 | FRED |
| FLOT spread (OAS) | 0.38% | 7 Oct 2026 | iShares |
| FLOT NAV / closing price | $50.88 / $50.93 | 8 Oct 2026 | iShares |
| FLOT 52-week NAV range | $50.76-$51.05 | 8 Oct 2026 | iShares |
| FLOT 30-day SEC yield / avg coupon | 4.08% / 4.50% | 7 Oct 2026 | iShares |
What markets expect next (Assessment). A weak September jobs report (+29,000 jobs, unemployment up to 4.2%) cut the market-implied chance of an October hike to about 22%, from roughly 70% a week earlier (FXStreet, citing CME FedWatch; Kalshi). Both sources still show one more hike by year-end as the most likely path. These are secondary market commentaries, so I treat them as indicative.
What FLOT actually holds (Fact). 553 bonds; average life 1.85 years; ratings 22% AAA, 26% AA, 45% A and 6% BBB. The biggest single fact for risk is sector: 47.5% banks and 19% supranationals (iShares). A bank-funding scare therefore matters far more to this market than a general recession in, say, retail.
Credit health (mixed evidence). The Fed found public-company debt service solid and bank capital near historic highs, with stress concentrated in leveraged loans and private credit (Fed FSR). The ECB warned that risk premia are compressed and could reprice sharply if the war drags on (ECB FSR). One secondary source citing S&P counts 45 global defaults by 18 June 2026, against 151 at the same point of 2020; S&P also recorded no investment-grade issuer defaults in 2025 (FIIG).
My reading. At 82 bp the investment-grade spread is tight, so the asymmetry is clear: spreads have more room to widen than to tighten. That caps FRN price upside at a few cents and puts the real risk on the downside.
A reading note on FLOT's price. FLOT pays a distribution of about $0.17-0.18 at the start of each month. Its price therefore climbs by roughly that amount during the month and drops on the ex-date (e.g. $51.05 on 30 Sept, $50.86 on 1 Oct). This is why the 8 January forecast in section 6 reads about $0.04 higher than the others.
5. What history says: eight stress episodes
In 15 years of data, rate hikes alone never pushed FRN prices down by more than about 1.5%; the two big falls (2011 and 2020) were credit and liquidity panics, and both recovered within months. The chart shows FLOT's month-end closing price from June 2011 to September 2026 (Digrin price history; recent daily closes from StockAnalysis).
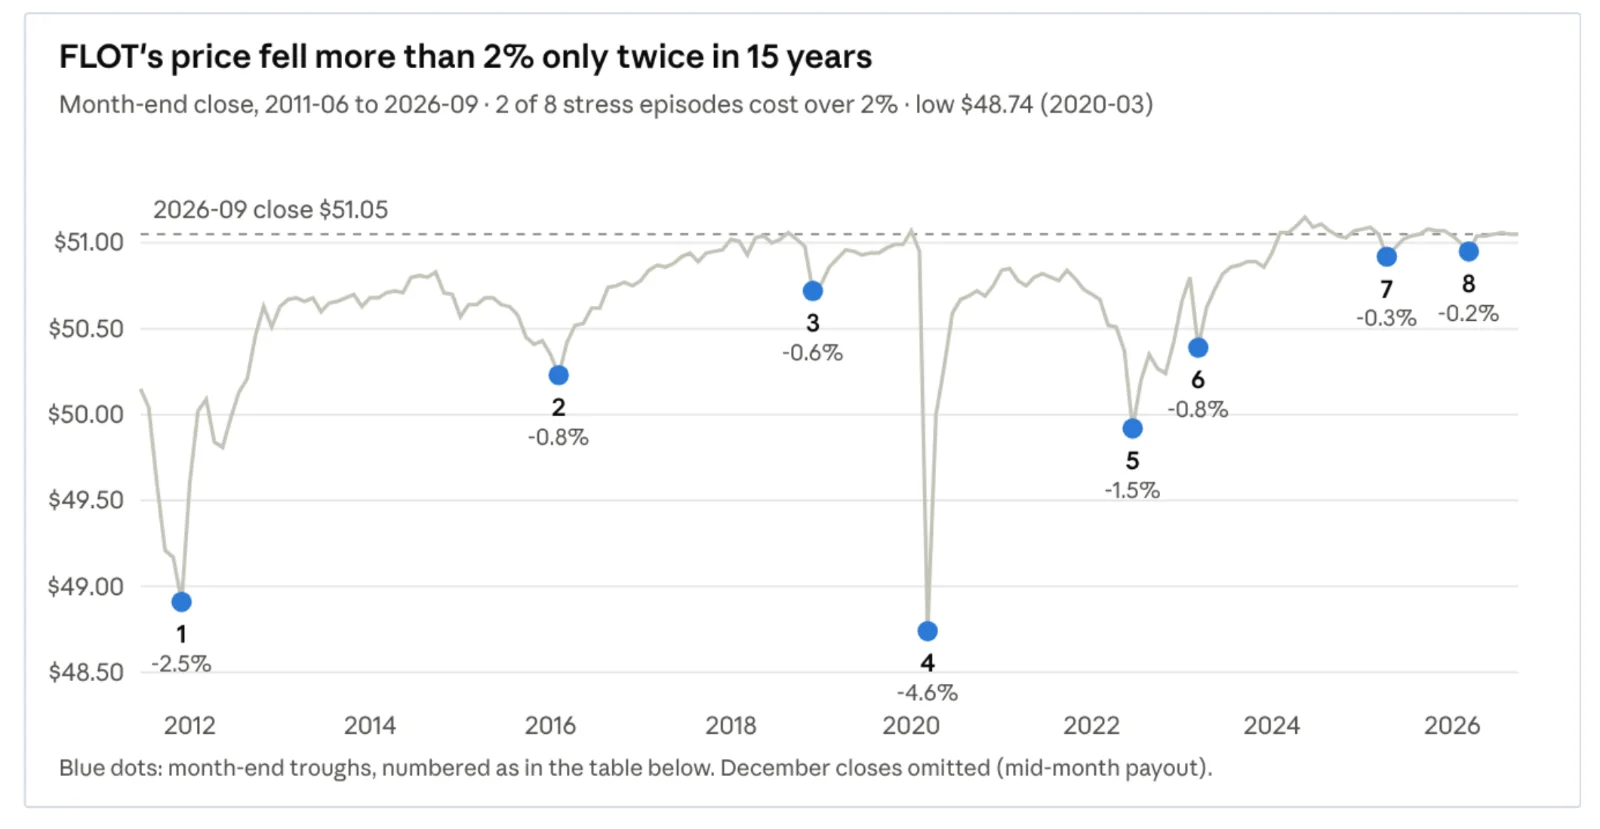
| # | Episode | Rates backdrop | Pre-shock trough (month end) | Fall | Months to recover 75% of the fall | Similarity to today (my view) |
|---|---|---|---|---|---|---|
| 5 | 2022 Ukraine-war energy shock | Fed hiked from near zero to 4.25-4.50% | Jan $50.70 Jun $49.92 | -1.5% | 7 | Highest: war-driven energy inflation plus fast hikes |
| 6 | Mar 2023 SVB failure | Fed still hiking | Feb $50.80 Mar $50.39 | -0.8% | 2 | High: bank stress in a bank-heavy index |
| 3 | Q4 2018 sell-off | Fed hiking to 2.25-2.50% with tight spreads | Sep $51.02 Nov $50.72 | -0.6% | 5 | High: hikes into tight spreads |
| 8 | Mar 2026 war outbreak | Fed on hold, hikes came later | Jan $51.04 Mar $50.95 | -0.2% | 1 | The current shock so far |
| 7 | Apr 2025 US tariff shock | Fed on hold | Mar $51.05 Apr $50.92 | -0.3% | 2 | Medium |
| 1 | 2011 euro bank crisis | ECB had hiked twice in 2011 | Jun $50.15 Nov $48.91 | -2.5% | 3 | Medium: European bank stress, but FLOT was new and small |
| 2 | 2015–16 oil and high-yield sell-off | First Fed hike, Dec 2015 | Jul $50.63 Feb $50.23 | -0.8% | 3 | Low |
| 4 | 2020 COVID dash for cash | Cuts to zero | Jan $51.07 Mar $48.74 | -4.6% | 3 | Low: the tail case |
Typical moves (Fact). Since 2013, FLOT's price over 3 months has changed by a median of +0.04% and fallen more than 1% only 2% of the time. Over 12 months the median change was +0.06%, the worst 5% of outcomes were below -0.85%, and a fall of more than 1% happened 5% of the time.
Three lessons for the forecast (My view).
- Hikes hurt mainly through credit. In the three hiking episodes (2018, 2022, 2023) the worst fall was 1.5%, driven mostly by wider spreads. In 2022 part of the loss also came from quarterly LIBOR resets lagging 0.75-point hikes, a channel that is much weaker for today's SOFR notes.
- Bank stress is the specific danger. With 47.5% of FLOT in banks, 2023 shows how fast a funding scare reaches FRN prices: 0.8% in one month.
- Losses mean-revert. In every episode at least 75% of the price fall was recovered within 7 months, helped by pull to par and coupon resets.
Limits. Month-end data hide intra-month lows. The Bloomberg FRN index fell up to 3.87% inside Q1 2020 (Merganser); one secondary source reports an intraday FLOT low of $42.84 on 18 March 2020, when the ETF traded far below its NAV (KoalaGains). I could not check that intraday figure against an exchange record, so I treat it as indicative. The 2008 crisis predates FLOT; Schwab notes floater prices fell sharply then (Schwab).
6. Price forecast: 3, 6 and 12 months
My central forecast is that investment-grade FRN prices end each horizon within a few cents of today: FLOT about $50.97 on 8 January 2027, $50.92 on 8 April and $50.91 on 8 October 2027, against $50.93 on 8 October 2026. The January figure is higher only because of payout timing, worth about $0.04; like for like, all three medians are flat. Downside risk grows with time: the 10th percentile falls from about -0.1% at 3 months to about -0.5% at 6 and 12 months. Almost all of the return will come from income of about 4.2% a year.
Total return, not just price
FLOT currently distributes about $0.17–0.18 per share each month (iShares). If the Fed hikes once more, coupons rise by about 0.25 points. Income earned is therefore about $0.53 over 3 months, $1.07 over 6 months and $2.15 over 12 months.
| Horizon | Median price change (like for like) | Income | Median total return | Bad case (5th percentile) |
|---|---|---|---|---|
| 3 months | 0.00% | +1.0% | +1.0% | about +0.6% |
| 6 months | -0.01% | +2.1% | +2.1% | about +1.3% |
| 12 months | -0.04% | +4.2% | +4.2% | about +3.4% |
What this means beyond FLOT
- A single bank FRN like the CIBC 2028 note should behave like the index: price near 100, moving about 1.65% for every 1 point change in its required margin. Its coupon rate would rise from roughly 4.54% to about 4.8% if SOFR follows the Fed's median path.
- US Treasury FRNs carry little credit spread risk, so I expect their prices to stay very close to par in every scenario except a Treasury-market liquidity event. This is my reasoning only; I have not checked it against Treasury FRN fund data.
- Euro FRNs follow the ECB, which has hiked twice in 2026 and projects 3.0% inflation this year. Coupons should stay at or above current levels. Price risk is again about bank and sovereign spreads, which the ECB says showed early divergence after the war began.
Signposts that would change my forecast
I state these in FLOT's own spread (OAS 0.38% on 7 October, iShares). The broad investment-grade index has longer maturities and more BBB bonds, and its moves do not map one-for-one onto FRN spreads.
- Signs of a wider spread repricing: FLOT's OAS rising above about 0.60% (+22 bp, a price hit of about 0.4%), or the Fed signalling more than one further hike at the 27–28 October or 8–9 December meetings.
- Signs of a bank or funding shock: FLOT's OAS above about 1.00%, a large bank's bond spreads gapping out, redemption gates spreading in private credit, or FLOT trading at more than a 0.5% discount to NAV.
- Signs of de-escalation: a credible ceasefire and a sustained fall in oil prices.
7. Conclusions and limits
Investment-grade FRNs look set to do what they were designed to do: pay a rising coupon while their price barely moves. My forecast is a flat like-for-like price (FLOT about $50.91–$50.93, or $50.97 quoted on 8 January because of payout timing) and a 12-month total return of about 4.2%. The risk of a temporary fall grows with time: roughly a 1-in-10 chance of more than 0.5% at 6 and 12 months, against about 0.1% at 3 months.
The 2026 story is renewed tightening driven by an energy shock, with credit spreads still tight. For FRN prices that combination is benign unless spreads reprice, and the one risk to watch most closely is bank funding stress.
Limits of this report.
- Month-end data. The history uses month-end ETF prices, which hide intra-month lows and include ETF premium/discount effects. Index-level daily data would be better.
- Short history. FLOT only starts in 2011, so 2008 is missing, and two of the eight episodes dominate the tail.
- Judgement in the forecast. History during hiking cycles was kinder than my forecast, so my downside may be too cautious; equally, a lasting re-rating of bank credit would make it too mild.
- Secondary sources. Market-implied Fed odds come from FXStreet and Kalshi commentary, and the 2026 default count from a secondary summary of S&P data.
- One issuer is not the index. An individual FRN can lose far more if its issuer is downgraded; diversification is what keeps the index near par.
This is coursework analysis, not investment advice.
Bibliography
- Federal Reserve - FOMC statement, 16 September 2026 https://www.federalreserve.gov/newsevents/pressreleases/monetary20260916a.htm
- Federal Reserve - FOMC statement, 29 July 2026 https://www.federalreserve.gov/newsevents/pressreleases/monetary20260729a.htm
- Federal Reserve - Summary of Economic Projections, September 2026 https://www.federalreserve.gov/monetarypolicy/fomcprojtabl20260916.htm
- Federal Reserve - Meeting calendars, 2026-2027 https://www.federalreserve.gov/monetarypolicy/fomccalendars.htm
- Federal Reserve - Financial Stability Report, May 2026: Overview https://www.federalreserve.gov/publications/2026-may-financial-stability-report-overview.htm
- European Central Bank - Monetary policy decisions, 10 September 2026 https://www.ecb.europa.eu/press/pr/date/2026/html/index.en.html
- European Central Bank - Financial Stability Review, May 2026 https://www.ecb.europa.eu/press/financial-stability-publications/fsr/html/ecb.fsr202605~50566915a7.en.html
- Banque de France - Key ECB interest rates and next decision date https://www.banque-france.fr/en/policy-rates
- Federal Reserve Bank of New York via FRED - Secured Overnight Financing Rate https://fred.stlouisfed.org/series/SOFR
- ICE Data Indices via FRED - ICE BofA US Corporate Index OAS https://fred.stlouisfed.org/series/BAMLC0A0CM
- Canadian Imperial Bank of Commerce - Pricing supplement, floating rate notes due 2028 (SEC filing) https://www.sec.gov/Archives/edgar/data/1045520/000191870426017537/form424b2.htm
- FINRA - Bonds investor guide https://www.finra.org/investors/investing/investment-products/bonds
- iShares (BlackRock) - iShares Floating Rate Bond ETF (FLOT) product page https://www.ishares.com/us/products/239534/ishares-floating-rate-bond-etf
- Digrin - FLOT monthly price history, 2011-2026 https://www.digrin.com/stocks/detail/FLOT/price
- StockAnalysis - FLOT daily price history https://stockanalysis.com/etf/flot/history/
- Merganser Capital Management - Floaters: Participating in the Upside of Higher Rates (Winter 2022) https://www.merganser.com/wp-content/uploads/2023/06/investment-memo-participating-in-the-upside-of-higher-rates.pdf?ki-cf-botcl=1
- Schwab Asset Management - Floating-Rate Notes: 4 Key Considerations https://www.schwab.com/learn/story/what-are-bonds-understanding-bond-types-and-how-they-work
- FIIG - Attempting to quantify the risk of bonds with credit ratings (15 July 2026) https://thewire.fiig.com.au/article/2026/07/15/attempting-to-quantify-the-risk-of-bonds-with-credit-ratings
- FXStreet - The October Fed hike just died (2 October 2026) https://www.fxstreet.com/analysis/the-october-fed-hike-just-died-heres-what-the-29k-jobs-report-really-means-for-rates-202610021806
- Kalshi - Fed rate hike odds plummet for October (5 October 2026) https://news.kalshi.com/p/fed-rate-hike-odds-plummet-october-after-september-jobs-miss
- KoalaGains - FLOT performance and returns (used only for the unverified 2020 intraday low) https://koalagains.com/etfs/BATS/FLOT/performance-returns